Geo-Causality ≠ Geo-Correlation
Seeing the pattern is not the same as understanding the cause.

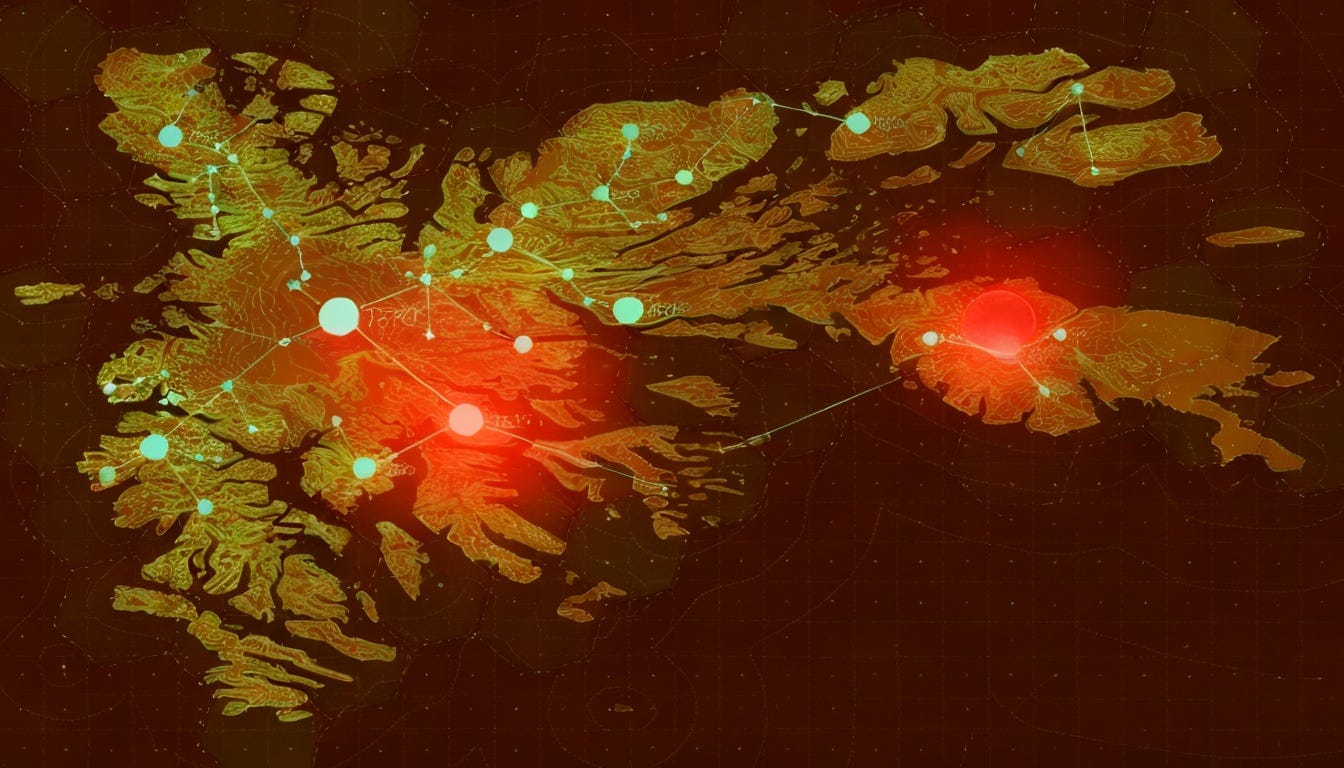
We love a good map. A bright red cluster of failures along a floodplain or power corridor feels like insight. It feels like certainty.
It’s neither.
Most of what we call “insight” today is just correlation. A spatial coincidence mistaken for understanding. We see where events happen. We fundamentally misunderstand why they happen there. This gap between observation and comprehension costs our industry billions annually in reactive maintenance and unplanned outages.
The next generation of resilience will not be built on coincidence; it will be built on causality.
The High Cost of the Correlation Trap
Correlation is comfortable. It gives us clean dashboards: “Outages increase with vegetation density.” “Failures rise during heavy rainfall.”
These statements are factual. They’re also dangerously shallow.
The reality is that most infrastructure failures involve multiple interacting factors, not single variables. Yet, our current models still optimize around simple relationships, such as rainfall or slope, or vegetation or age. We’re explaining a fraction of the variance and calling it insight.
This reactive posture isn’t just inefficient—it’s compounding. “Find and fix” strategies cost multiples more over time than targeted prevention based on root-cause understanding. We’re mapping the past and funding it repeatedly, rather than modeling the future and investing to shape it.
The Shift to Causality
Causality poses the more challenging question: What forces and interactions give rise to these spatial patterns?
It’s not about simple overlap. Infrastructure failure is a complex, dynamic system—the combination of terrain, soil moisture, vegetation health, infrastructure age, and specific weather events, all interacting in space and time.
Consider the evidence: slope failures don’t correlate linearly with rainfall alone. They correlate with rainfall threshold exceedance combined with soil saturation state, vegetation root depth, and antecedent moisture conditions from prior days or weeks. Remove any one factor, and the failure probability drops dramatically.
That’s the signature of causality—not additive risk, but multiplicative interaction.
This is where GeoAI becomes essential. Traditional analytics can only test a limited number of variable combinations. Modern machine learning can test orders of magnitude more: integrating LiDAR, SAR, IoT sensor streams, climate projections, and field data to identify the true causal pathways.
Early deployments demonstrate the impact: utilities utilizing causal AI models are achieving substantial reductions in high-consequence failures while reducing inspection costs, as they’re finally inspecting the right assets for the right reasons.
From Description to Diagnosis

Traditional GIS shows us what happened and where it occurred. GeoAI diagnoses the cause and predicts the next steps.
Using explainable machine learning, we can rank the proper drivers of failure with quantified confidence. We can test counterfactuals (”What if soil moisture had been lower?”). We can simulate alternate futures under different climate or maintenance scenarios.
This is the pivot: from description to diagnosis. From probability to mechanism.
A probability model tells us that an asset has an elevated failure risk. A causal model indicates that it will fail when soil moisture exceeds a threshold, temperature drops rapidly, and loading increases during seasonal transitions—a specific, actionable mechanism that we can engineer around.
How This Works in Practice
A pipeline operator observes that slope failures increase when rainfall exceeds certain thresholds. That’s correlation. A measure that facilitates widespread slope monitoring across entire networks.
The causal story is different. GeoAI analysis of failure data reveals that the vast majority of actual failures occur only where that rainfall intersects with a precise combination of conditions:
Slopes within specific angle ranges where vegetation dynamics create vulnerability
Soil types with particular shear strength characteristics
Elevated antecedent moisture from recent precipitation
Vegetation root systems compromised by recent maintenance activity
It’s not just the rain. It’s the precise confluence of conditions that creates a critical vulnerability.
With that causal insight, the strategy undergoes a transformation. Instead of monitoring everywhere, you target high-interaction zones with focused slope reinforcement, adjust maintenance cycles to preserve root structure, and implement strategic drainage improvements.
The result: dramatic reductions in slope-related incidents, substantial avoided emergency repairs, and significant decreases in monitoring overhead.
You’ve moved from observation to prevention.
The New Strategic Imperative
We have invested extensively in sensing, surveying, and mapping our assets. It is time to invest in understanding them.
Geo-causality is the next evolution of infrastructure intelligence. It’s what turns passive monitoring into active decision-making. It’s how we stop managing by averages and start working by mechanism.
Organizations deploying causal analytics are seeing meaningful improvements in capital efficiency and substantial reductions in high-severity events. Not because they have more data, but because they finally understand what the data means.
This shift moves us from reactive alerts to genuine foresight. The leaders who adopt this approach will shape the future of resilience. Not by how fast they respond, but by how deeply they understand the system before it fails, and how this understanding allows them to focus their resilience capital.
Correlation makes us observers. Causality makes us architects.
Our task is no longer to map what is happening; it is to understand what is happening. It is to model why it is happening, so we can design infrastructure built to withstand it.
That is a value of GeoAI. It’s marking the beginning of the next era of resilience.